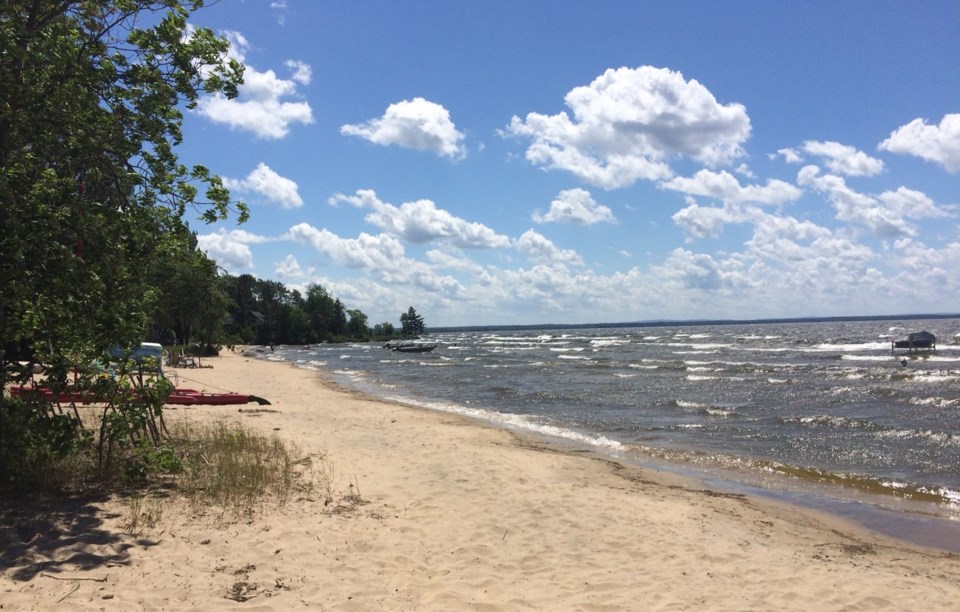
The price for waterfront recreational properties in North bay jumped 21 per cent over the past year, but still looks cheap compared to its neighbours in Parry Sound or Orillia.
Ahead of the Canada Day long weekend, which many Canadians will spend at a cottage or cabin, RE/MAX released its 2017 Recreational Property Report this morning. The report highlights trends and pricing information in recreational property markets across Canada including North Bay, Haliburton, Wasaga Beach, the Kawarthas, Grand Bend and the Rideau Lakes Region among other Ontario regions.
Key findings includd:
- 41 per cent of Ontarians feel that high housing prices in their primary housing market will discourage them from purchasing a recreational property in addition to owning a primary residence
- More than 1 in 4 Ontarians (27 per cent) would consider buying with a family member in order to help finance recreational property ownership
- Over a quarter of Canadians (28 per cent) with children under the age of 18 would consider selling their primary residence in the city in which they live to help finance the purchase of a cottage or cabin
- Young families are fueling demand: 73 per cent of regions surveyed reported that young families with children drive demand for recreational properties
- Buyers are increasingly selling their homes in Canada’s two largest urban centres and using the equity from the sale to purchase a cottage, cabin or ski chalet
- Almost two-thirds (65 per cent) of Canadian millennials (18-34 years old) would consider buying a recreational property in the next 10 years
|
Region |
Housing Type |
2015/2016 Median Price |
2016/2017 Median Price |
Year-over-year median price |
2015/2016 Sales |
2016/2017 Sales |
Year-over-year sales |
|
Bruce Peninsula |
Waterfront |
$329,572 |
$376,398 |
14.21% |
109 |
147 |
34.86% |
|
Bruce Peninsula |
Non-waterfront |
$208,041 |
$272,114 |
30.80% |
332 |
383 |
15.36% |
|
Grand Bend |
Non-waterfront |
$247,000 |
$290,000 |
17.41% |
128 |
239 |
86.72% |
|
Haliburton |
Waterfront |
$206,628 |
$240,067 |
16.18% |
244 |
347 |
42.21% |
|
Haliburton |
Non-waterfront |
$46,573 |
$66,038 |
41.79% |
368 |
516 |
40.22% |
|
Haliburton |
Water Access |
$189,623 |
$210,000 |
10.75% |
116 |
127 |
9.48% |
|
Parry Sound |
Waterfront |
$380,000 |
$410,000 |
7.89% |
231 |
287 |
24.24% |
|
WasagaBeach/Southern Georgian Bay |
Non-waterfront |
$324,065 |
$393,237 |
21.35% |
610 |
601 |
-1.48% |
|
Orillia |
Waterfront |
$365,000 |
$441,500 |
20.96% |
244 |
257 |
5.33% |
|
North Bay |
Waterfront |
$236,000 |
$286,000 |
21.19% |
99 |
131 |
32.32% |
|
Peterborough and Kawarthas (East) |
Waterfront |
$390,000 |
$425,000 |
8.97% |
456 |
497 |
8.99% |
|
Prince Edward County |
Waterfront |
$415,000 |
$575,000 |
38.55% |
126 |
139 |
10.32% |
|
Bancroft |
Waterfront |
$278,000 |
$308,000 |
10.79% |
200 |
173 |
-13.50% |
|
Rideau Lakes |
Waterfront |
$386,000 |
$452,000 |
17.10% |
44 |
101 |
129.55% |
|
Rideau Lakes |
Non-waterfront |
$195,000 |
$206,000 |
5.64% |
338 |
400 |
18.34% |
* Year-over-year median price changes were only recorded for housing types in regions with more than 100 sales
