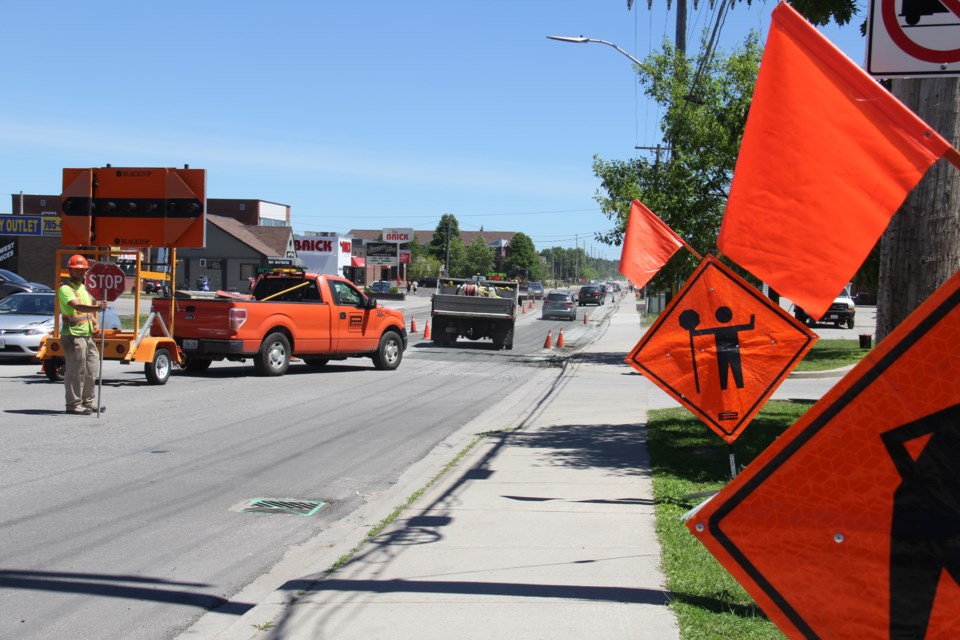
A smaller share of infrastructure assets owned by municipalities in our region is deemed to be "in a state of good repair," as compared to the provincial average, according to the Financial Accountability Office of Ontario (FAO).
In its report, introduced Tuesday, the FAO estimates 45 per cent of municipal infrastructure in the province needs repairs after reviewing the assets — including roads and bridges, water systems, transit, and buildings and facilities — owned by all 444 of Ontario’s municipalities.
In the local region, the share of municipal assets in need of repair is estimated by FAO as 54.2 per cent.
The FAO also estimates the current replacement value (CRV) and condition of that infrastructure and the cost in 2020 dollars needed to bring those assets into a state of good repair. CRV is defined as "the current cost of rebuilding an asset with the equivalent capacity, functionality, and performance of the original asset."
For the purposes of this study, the province is divided into 11 economic regions, with North Bay and its surrounding communities assigned to the 276,368 square-kilometre Northeast Region stretching north to the James Bay coast and west to Sault Ste. Marie. The population of the Northeast Region, via Statistics Canada is 568,361 or 3.9 per cent of Ontario's total. The region's land area of 276,368 kilometres squared accounts for 30.4% of the province. For a full list of municipalities in each region, click here.
Although the Northeast Region is below the provincial average in overall share of assets in a state of good repair (see chart above), 45.8 per cent compared to 54.7 per cent for Ontario, the region's roads are found to be in slightly better repair 44.5 per cent compared to 43.8 per cent. FAO finds the Northeast's bridges and culverts are 52.6 per cent in good repair, while the province's number is 50.2 per cent.
The municipal infrastructure backlog is the "capital spending required to bring assets up to a state of good repair," in Ontario, estimated at $52 billion in 2020. Roads and bridges make up almost half of the total backlog, while water infrastructure makes up almost a third.
The Northeast Region's backlog as a share of current replacement value is higher at 17.2 per cent than the Ontario average of 11.9 per cent. In fact, the backlog in the Northeast Region is higher in each of the categories: bridges and culverts; roads; potable water; storm water; wastewater; and, other buildings and facilities (see chart above). It is markedly higher in wastewater 20.4 per cent versus 8.8 per cent and in other buildings and facilities at 20.4 per cent versus 13.5 per cent.
There are two regions with higher infrastructure repair backlogs than the Northeast's 17.2, according to the report.
"There is a large variation in the state of repair of municipal infrastructure across Ontario’s economic regions. The region with the largest share of assets in a state of good repair is the Toronto economic region at 62.3 per cent, which is 7.6 percentage points higher than the provincewide average. In contrast, the Ottawa economic region has the lowest share of assets in a state of good repair at 38.7 percent, 16.1 percentage points lower than the provincewide average.
"The infrastructure backlog can also be presented as a share of total current replacement value, which allows for comparisons across regions. The regions of Toronto (9.0 per cent) and London (10.9 per cent) have the lowest shares, implying that their assets are in better condition compared to other regions. In contrast, the region with the largest infrastructure backlog relative to its total CRV is Kingston-Pembroke, at 19.7 per cent, followed by Stratford-Bruce Peninsula at 17.9 per cent."
The FAO notes municipal water infrastructure across the province — potable water, storm water and wastewater — has a current replacement value of $229 billion (47 per cent of the municipal total).
The study finds the CRV of all of the infrastructure assets in the municipalities in the Northeast Region totals $14.6 billion, which accounts for a three per cent share of CRV province-wide. According to the FAO, the region has a $2.1 billion infrastructure backlog, accounting for four per cent of the backlog in Ontario.
Ontario’s municipalities own and manage the majority of public infrastructure in the province, more than both the federal and provincial governments combined, according to the FAO, which estimates the CRV of municipal infrastructure assessed in this report was $484 billion in 2020 — nearly double the $265 billion in infrastructure owned by Ontario.
The current cost to bring municipal assets into a state of good repair (in other words, to eliminate the municipal infrastructure backlog) is about $52 billion, according to the FAO. Municipal roads represent the largest share of the infrastructure backlog at $21.1 billion, followed by buildings and facilities ($9.5 billion), wastewater ($7.3 billion), potable water ($5.3 billion), and bridges and culverts ($4.3 billion).
The Financial Accountability Office (FAO) provides independent analysis on the state of Ontario's finances, trends in the provincial economy, and related matters important to the Legislative Assembly of Ontario. The municipal infrastructure report is the second of the FAO’s three-stage analysis of the impact of select climate change hazards on provincial and municipal infrastructure. The first report, Provincial Infrastructure, was released in November 2020.
The FAO concludes with, "Maintaining public infrastructure in a state of good repair is generally the most cost-effective strategy over an asset’s life cycle, although it is not the only consideration of municipal asset managers and may conflict with other budgetary priorities. Postponing repairs raises the risk of service disruption and increases the costs associated with municipal infrastructure over time."
